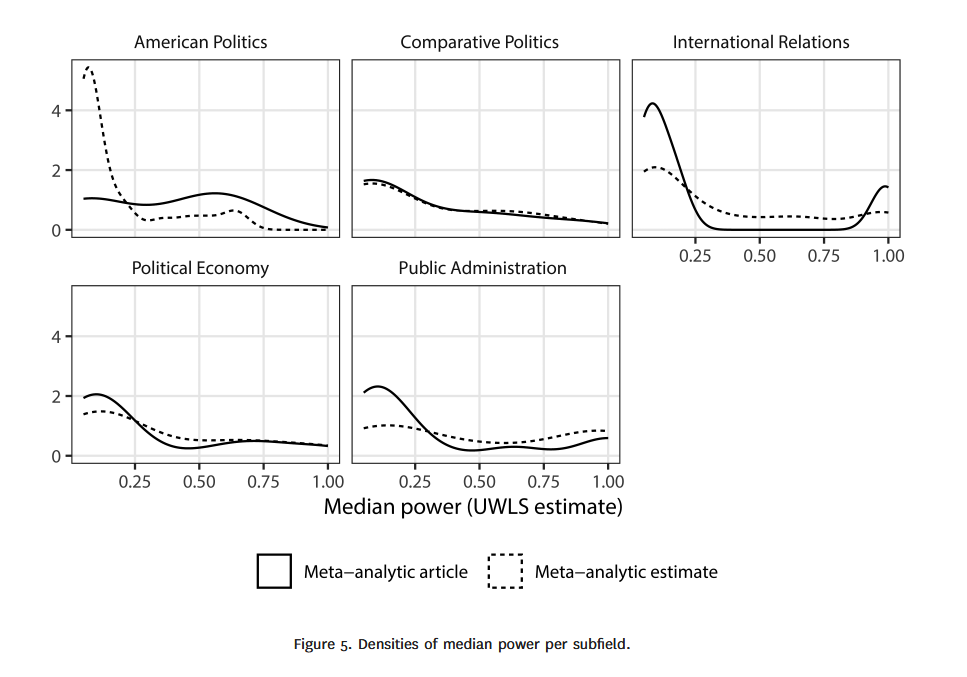
class: center, middle, inverse, title-slide .title[ # 13: Statistical Power. ] .subtitle[ ## Linear Models ] .author[ ### <large>Jaye Seawright</large> ] .institute[ ### <small>Northwestern Political Science</small> ] .date[ ### Feb. 18, 2026 ] --- class: center, middle <style type="text/css"> pre { max-height: 400px; overflow-y: auto; } pre[class] { max-height: 200px; } </style> If we want a good estimate of `\(\hat \beta_1\)`, with a small standard error and a good chance of statistically significant results if the population value of `\(\beta_1\)` is not close to zero, how large should we make our sample? --- ###Statistical Power *Statistical power* is the probability, before data are gathered, that a particular test will pass a threshold at some predetermined significance level (typically a p-value below 0.05), given some assumed population parameter. `$$\small\text{Power} = \text{Pr}_{\text{Prior}} (\text{Reject } H_{0} | \text{a specific version of }H_{1} \text{ is true})$$` --- ###Problems with Low Power 1. *High Rate of False Negatives*: You will frequently fail to reject the null hypothesis (Type II errors), even when a meaningful effect exists. This leads to missed discoveries and can bias the literature through publication bias. 2. *"Significant" Results are Often Misleading*: When you do find a statistically significant result (p < 0.05) in a low-power study, the estimated effect is likely exaggerated or could be a false positive. The low signal-to-noise ratio (high standard errors) means that passing the high statistical threshold often requires a large, luck-driven estimate. --- <img src="StatisticalPower_files/figure-html/unnamed-chunk-2-1.png" width="80%" style="display: block; margin: auto;" /> --- <img src="StatisticalPower_files/figure-html/unnamed-chunk-3-1.png" width="80%" style="display: block; margin: auto;" /> --- <img src="StatisticalPower_files/figure-html/unnamed-chunk-4-1.png" width="80%" style="display: block; margin: auto;" /> ``` r # Load required libraries library(ggplot2) library(dplyr) library(tidyr) library(patchwork) # For combining plots library(scales) # For better scale formatting # Set seed for reproducibility set.seed(2024) # Simulation parameters n_simulations <- 10000 # Number of studies to simulate true_effect_size <- 0.2 # True population effect (e.g., correlation coefficient) alpha <- 0.05 # Significance level # Create a function to simulate one study simulate_study <- function(n, true_effect, alpha_level = 0.05) { # Generate data for two groups (treatment and control) # Using a simple normal model: Y = treatment_effect + error control_group <- rnorm(n/2, mean = 0, sd = 1) treatment_group <- rnorm(n/2, mean = true_effect, sd = 1) # Run a t-test test_result <- t.test(treatment_group, control_group, var.equal = TRUE) # Calculate observed effect size (standardized bivariate coefficient for treatment v. control) pooled_sd <- sqrt(((n/2 - 1) * var(control_group) + (n/2 - 1) * var(treatment_group)) / (n - 2)) observed_d <- (mean(treatment_group) - mean(control_group)) / pooled_sd # Return results return(data.frame( n = n, p_value = test_result$p.value, observed_effect = observed_d, significant = test_result$p.value < alpha_level, ci_lower = test_result$conf.int[1] / pooled_sd, ci_upper = test_result$conf.int[2] / pooled_sd )) } # Run simulation for different sample sizes (low vs high power) sample_sizes <- c(50, 200, 800) # Small, medium, large N results <- data.frame() for (n in sample_sizes) { for (i in 1:n_simulations) { study_result <- simulate_study(n, true_effect_size, alpha) results <- rbind(results, study_result) } } # Calculate power for each sample size power_calc <- results %>% group_by(n) %>% summarize( power = mean(significant), mean_observed = mean(observed_effect), mean_observed_sig = mean(observed_effect[significant]), prop_sig = mean(significant), n_studies = n() ) %>% mutate( power_theoretical = round(power * 100, 1), label = paste0("N = ", n, "\nPower = ", power_theoretical, "%") ) # Create Plot 1: Distribution of observed effects (all studies) p1 <- ggplot(results, aes(x = observed_effect, fill = factor(n))) + geom_density(alpha = 0.6, adjust = 1.5) + geom_vline(xintercept = true_effect_size, linetype = "dashed", color = "red", size = 1) + facet_wrap(~ n, ncol = 1, labeller = labeller(n = function(x) paste0("N = ", x))) + labs( title = "Distribution of Estimated Coefficients", subtitle = paste0("Population Coefficient (red line) = ", true_effect_size), x = "Estimated Coefficient", y = "Density", caption = "All simulated studies (significant and non-significant)" ) + theme_minimal(base_size = 12) + theme( legend.position = "none", plot.title = element_text(face = "bold", size = 14), strip.text = element_text(face = "bold", size = 11) ) + scale_fill_brewer(palette = "Set2") # Create Plot 2: "Winner's Curse" - Only significant results p2 <- ggplot(results %>% filter(significant == TRUE), aes(x = observed_effect, fill = factor(n))) + geom_density(alpha = 0.6, adjust = 1.5) + geom_vline(xintercept = true_effect_size, linetype = "dashed", color = "red", size = 1) + facet_wrap(~ n, ncol = 1, labeller = labeller(n = function(x) { power_val <- power_calc$power_theoretical[power_calc$n == as.numeric(x)] paste0("N = ", x, " (Power = ", power_val, "%)") })) + labs( title = '"Winner\'s Curse": Distribution of Statistically Significant Estimates', subtitle = paste0("Population Coefficient (red line) = ", true_effect_size), x = "Estimated Coefficient", y = "Density", caption = "Only studies with p < 0.05 (the 'winners')" ) + theme_minimal(base_size = 12) + theme( legend.position = "none", plot.title = element_text(face = "bold", size = 14), strip.text = element_text(face = "bold", size = 10) ) + scale_fill_brewer(palette = "Set2") + coord_cartesian(xlim = c(-0.5, 1.5)) # Consistent x-axis # Create Plot 3: Distortions in effect estimates (summary) summary_data <- results %>% group_by(n, significant) %>% summarize( mean_effect = mean(observed_effect), median_effect = median(observed_effect), sd_effect = sd(observed_effect), n_studies = n(), .groups = 'drop' ) %>% mutate( significance = ifelse(significant, "Significant (p < 0.05)", "Non-significant"), bias = mean_effect - true_effect_size ) p3 <- ggplot(summary_data, aes(x = factor(n), y = mean_effect, fill = significance)) + geom_bar(stat = "identity", position = position_dodge(width = 0.9), width = 0.8, alpha = 0.8) + geom_hline(yintercept = true_effect_size, linetype = "dashed", color = "red", size = 1) + geom_errorbar(aes(ymin = mean_effect - 1.96 * sd_effect / sqrt(n_studies), ymax = mean_effect + 1.96 * sd_effect / sqrt(n_studies)), position = position_dodge(width = 0.9), width = 0.3) + labs( title = "Distortions in Coefficient Estimates by Significance and Sample Size", subtitle = paste0("Population Coefficient (red line) = ", true_effect_size), x = "Sample Size (N)", y = "Mean Estimated Coefficient", fill = "Statistical Significance" ) + theme_minimal(base_size = 12) + theme( legend.position = "bottom", plot.title = element_text(face = "bold", size = 14), axis.text.x = element_text(size = 11) ) + scale_fill_manual(values = c("Non-significant" = "#999999", "Significant (p < 0.05)" = "#E69F00")) # Create Plot 4: Probability of overestimation overestimation_data <- results %>% group_by(n) %>% summarize( prop_overestimate_sig = mean(observed_effect[significant] > true_effect_size), prop_severe_overestimate_sig = mean(observed_effect[significant] > true_effect_size * 1.5), n_sig = sum(significant)) %>% pivot_longer(cols = starts_with("prop"), names_to = "metric", values_to = "probability") %>% mutate( metric = case_when( metric == "prop_overestimate_sig" ~ "Significant studies overestimate population coefficient", metric == "prop_severe_overestimate_sig" ~ "Significant studies >1.5x population coefficient"), metric = factor(metric, levels = c( "Significant studies overestimate population coefficient", "Significant studies >1.5x population coefficient"))) p4 <- ggplot(overestimation_data, aes(x = factor(n), y = probability, fill = metric)) + geom_bar(stat = "identity", position = position_dodge(width = 0.9), width = 0.8, alpha = 0.8) + scale_y_continuous(labels = percent_format()) + labs( title = "Probability of Overestimation", subtitle = "The 'Winner's Curse' becomes more severe with lower power", x = "Sample Size (N)", y = "Probability", fill = "Type of Overestimation" ) + theme_minimal(base_size = 12) + theme( legend.position = "bottom", plot.title = element_text(face = "bold", size = 14), legend.text = element_text(size = 9) ) + scale_fill_brewer(palette = "Set2") + geom_text(aes(label = paste0(round(probability * 100, 1), "%")), position = position_dodge(width = 0.9), vjust = -0.5, size = 3.5) ``` --- <img src="StatisticalPower_files/figure-html/unnamed-chunk-6-1.png" width="80%" style="display: block; margin: auto;" /> --- <img src="StatisticalPower_files/figure-html/unnamed-chunk-7-1.png" width="80%" style="display: block; margin: auto;" /> --- <img src="StatisticalPower_files/figure-html/unnamed-chunk-8-1.png" width="80%" style="display: block; margin: auto;" /> --- <img src="StatisticalPower_files/figure-html/unnamed-chunk-9-1.png" width="80%" style="display: block; margin: auto;" /> --- When designing a study: 1\. *Increase signal strength first*. This can involve designing experimental treatments to be as strong as possible, choosing participants to be as susceptible to the cause of interest as you can, etc. Increasing the distance between the population parameter and zero quickly increases your power and reduces the winner's curse. --- When designing a study: 2\. *Minimize noise through design.* Randomness isn't always a given, any more than effect size is. You can use clever sampling strategies, improve measurement, or compare before and after within the same subjects to reduce overall variation. Reducing variation is another great way to increase power. --- When designing a study: 3\. *Increase sample size.* When other choices are unavailable, increasing sample size is an expensive but still valid way to avoid the problems of low power and resulting low credibility. --- ### Reading Published Research * *Expect overestimation.* Published effect sizes tend to be inflated due to the winner's curse that we've discussed, given that significant results are conditionally biased upward. * *Why?* The publishing process selects for statistical significance. Conditional on `\(p < 0.05\)`, estimates tend to exceed the true effect, especially when power is low. --- There are published formulae for several different kinds of power calculations. --- Consider a one-sided difference-in-means test. The required sample size to reach a significance level of `\(\alpha\)` with power `\(1 - \beta\)` when the population difference in means is `\(\mu - \mu_{0}\)` away from the null hypothesis is: `$$n = \left[\frac{(Z_{\alpha} + Z_{\beta})\sigma}{\mu - \mu_{0}}\right]^2$$` --- So, for example, if we have a difference in means of .6, a standard deviation of 2, `\(\alpha = 0.05\)`, and `\(\beta=0.20\)`. Then: `$$n = \left[\frac{1.64 + 0.84)2}{0.6}\right]^2 \approx 68$$` --- Or you can use R. --- ``` r library(pwrss) power.t.regression(beta = 0.60, sd.outcome = 12, sd.predictor = 4, k.total = 12, r.squared = 0.30, power = .80, alpha = 0.05, alternative = "two.sided") ``` ``` ## +--------------------------------------------------+ ## | SAMPLE SIZE CALCULATION | ## +--------------------------------------------------+ ## ## Linear Regression Coefficient (T-Test) ## ## --------------------------------------------------- ## Hypotheses ## --------------------------------------------------- ## H0 (Null Claim) : beta - null.beta = 0 ## H1 (Alt. Claim) : beta - null.beta != 0 ## ## --------------------------------------------------- ## Results ## --------------------------------------------------- ## Sample Size = 140 << ## Type 1 Error (alpha) = 0.050 ## Type 2 Error = 0.198 ## Statistical Power = 0.802 ``` --- ``` r library(pwrss) power.t.regression(beta = 0.10, sd.outcome = 12, sd.predictor = 4, k.total = 12, r.squared = 0.30, power = .80, alpha = 0.05, alternative = "two.sided") ``` ``` ## +--------------------------------------------------+ ## | SAMPLE SIZE CALCULATION | ## +--------------------------------------------------+ ## ## Linear Regression Coefficient (T-Test) ## ## --------------------------------------------------- ## Hypotheses ## --------------------------------------------------- ## H0 (Null Claim) : beta - null.beta = 0 ## H1 (Alt. Claim) : beta - null.beta != 0 ## ## --------------------------------------------------- ## Results ## --------------------------------------------------- ## Sample Size = 4947 << ## Type 1 Error (alpha) = 0.050 ## Type 2 Error = 0.200 ## Statistical Power = 0.8 ``` --- ``` r library(pwrss) power.t.regression(beta = 0.60, sd.outcome = 60, sd.predictor = 4, k.total = 12, r.squared = 0.30, power = .80, alpha = 0.05, alternative = "two.sided") ``` ``` ## +--------------------------------------------------+ ## | SAMPLE SIZE CALCULATION | ## +--------------------------------------------------+ ## ## Linear Regression Coefficient (T-Test) ## ## --------------------------------------------------- ## Hypotheses ## --------------------------------------------------- ## H0 (Null Claim) : beta - null.beta = 0 ## H1 (Alt. Claim) : beta - null.beta != 0 ## ## --------------------------------------------------- ## Results ## --------------------------------------------------- ## Sample Size = 3436 << ## Type 1 Error (alpha) = 0.050 ## Type 2 Error = 0.200 ## Statistical Power = 0.8 ``` --- ``` r library(pwrss) power.t.regression(beta = 0.60, sd.outcome = 12, sd.predictor = 4, k.total = 12, r.squared = 0.10, power = .80, alpha = 0.05, alternative = "two.sided") ``` ``` ## +--------------------------------------------------+ ## | SAMPLE SIZE CALCULATION | ## +--------------------------------------------------+ ## ## Linear Regression Coefficient (T-Test) ## ## --------------------------------------------------- ## Hypotheses ## --------------------------------------------------- ## H0 (Null Claim) : beta - null.beta = 0 ## H1 (Alt. Claim) : beta - null.beta != 0 ## ## --------------------------------------------------- ## Results ## --------------------------------------------------- ## Sample Size = 179 << ## Type 1 Error (alpha) = 0.050 ## Type 2 Error = 0.199 ## Statistical Power = 0.801 ``` --- How useful is a power calculation after the study has been carried out? --- 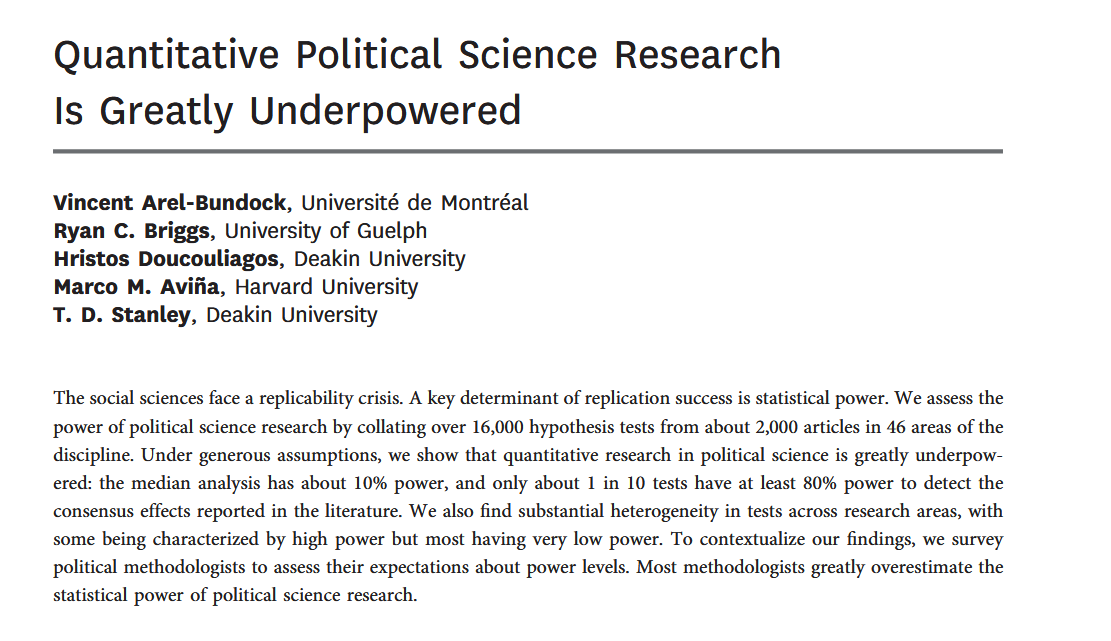 --- 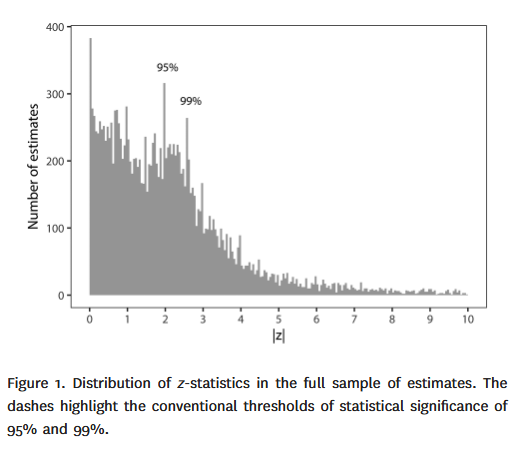 --- 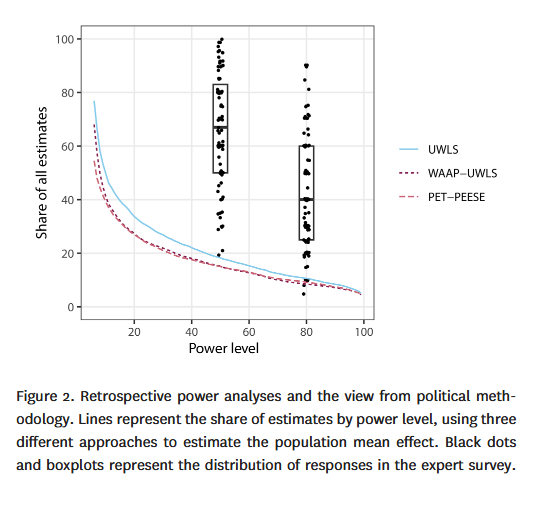 ---